Observations in nuclear glass
Many phenomena of demixing are observed in nuclear glass at CEA of Marcoule. The nuclear glass is a multi-component system which is composed of twenty (or more) chemical species (or components). In this documentation, when one system is composed of two components, it will be qualified of binary. When it is composed of three components, it will be qualified of ternary. The nuclear glass is an example of multi-component system. At macroscopic scale and high temperature, the nuclear glass is usually considered as a single-phase system. However, for specific conditions of temperature and global composition, several observations show two phases, either liquid/liquid, or solid/liquid. The objective of LBM_Saclay is to model and simulate those phenomena in order to simulate them by varying the temperature and the composition of the system.
Liquid-Liquid interface
Demixing phenomena between two liquid phases are observed in nuclear glass such as the nucleation and growth (Fig. 1) and spinodal decomposition (Fig. 2). Those phenomena occur at high temperature when the temperature is below a critical temperature (see next section).
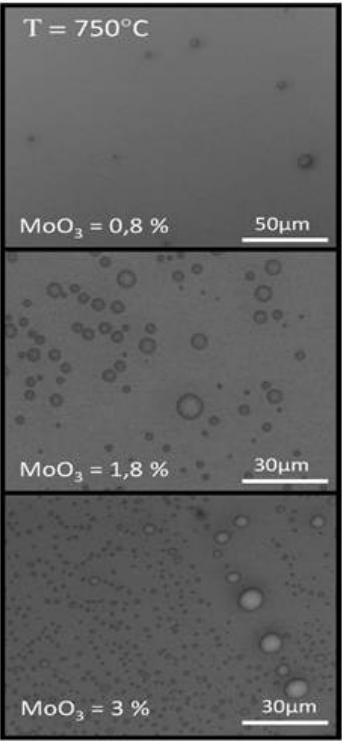
Fig. 1 Nucleation and growth (S. Schuller ISEC/DPME, 2013)
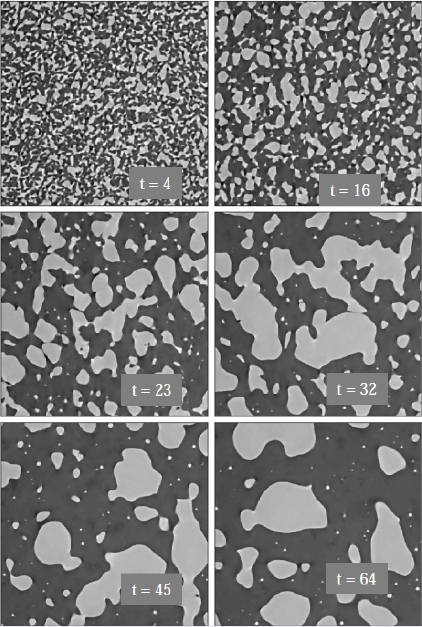
Fig. 2 Spinodal decomposition (D. Bouttes, PhD 2015)
Solid-Liquid interface
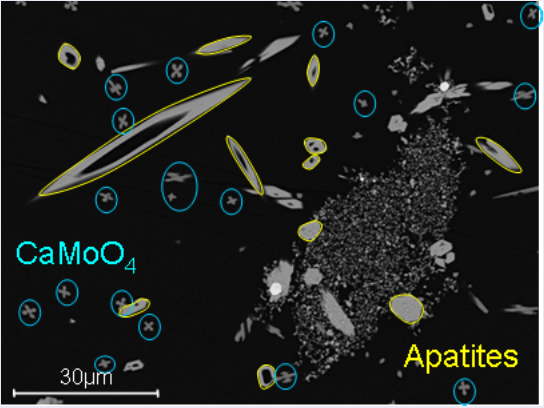
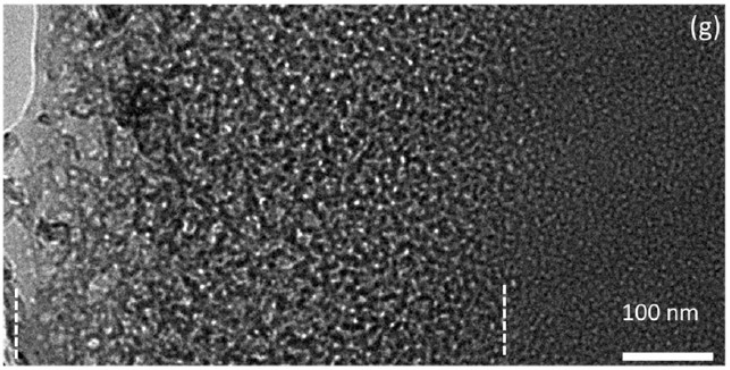
When the temperature is lowered, a phase solid/liquid change occurs for some species and .*crystal growth* (Fig. 3), is observed. Various gemetric shapes are observed. Finally at lower temperature, when glass and water are in contact, a phenomenon of gel maturation (Fig. 4) is observed.
Thermodynamics
Those phenomena occur because they depend on the thermodynamic and they make appear an interface which separates two or several phases. The thermodynamics of a binary system is sketched on Fig. 5. On that figure, when the temperature \(T\) is above a critical temperature \(T>T_c\), we observe only one phase. But when the temperature is below that critical temperature \(T<T_c\), we observe two phases, provided that the point of composition \(C\) and temperature \(T\) is within the red curve (binodal line). The demixing can occur into two different regimes: when the composition is inside the black line (spinodal line) the spinodal regime is observed, whereas the nucleation and growth regime is observed in other cases.
For three components, the phase diagram is much more complicated. It is represented by the Gibbs triangle (Fig. 6) where the green lines are the conodes. On that figure, the miscibility gap is the area where the observations confirm the presence of two phases (blue dots).
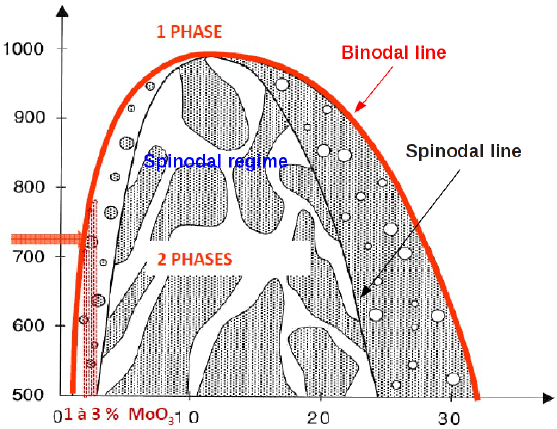
Fig. 5 Thermodynamics of phase separation
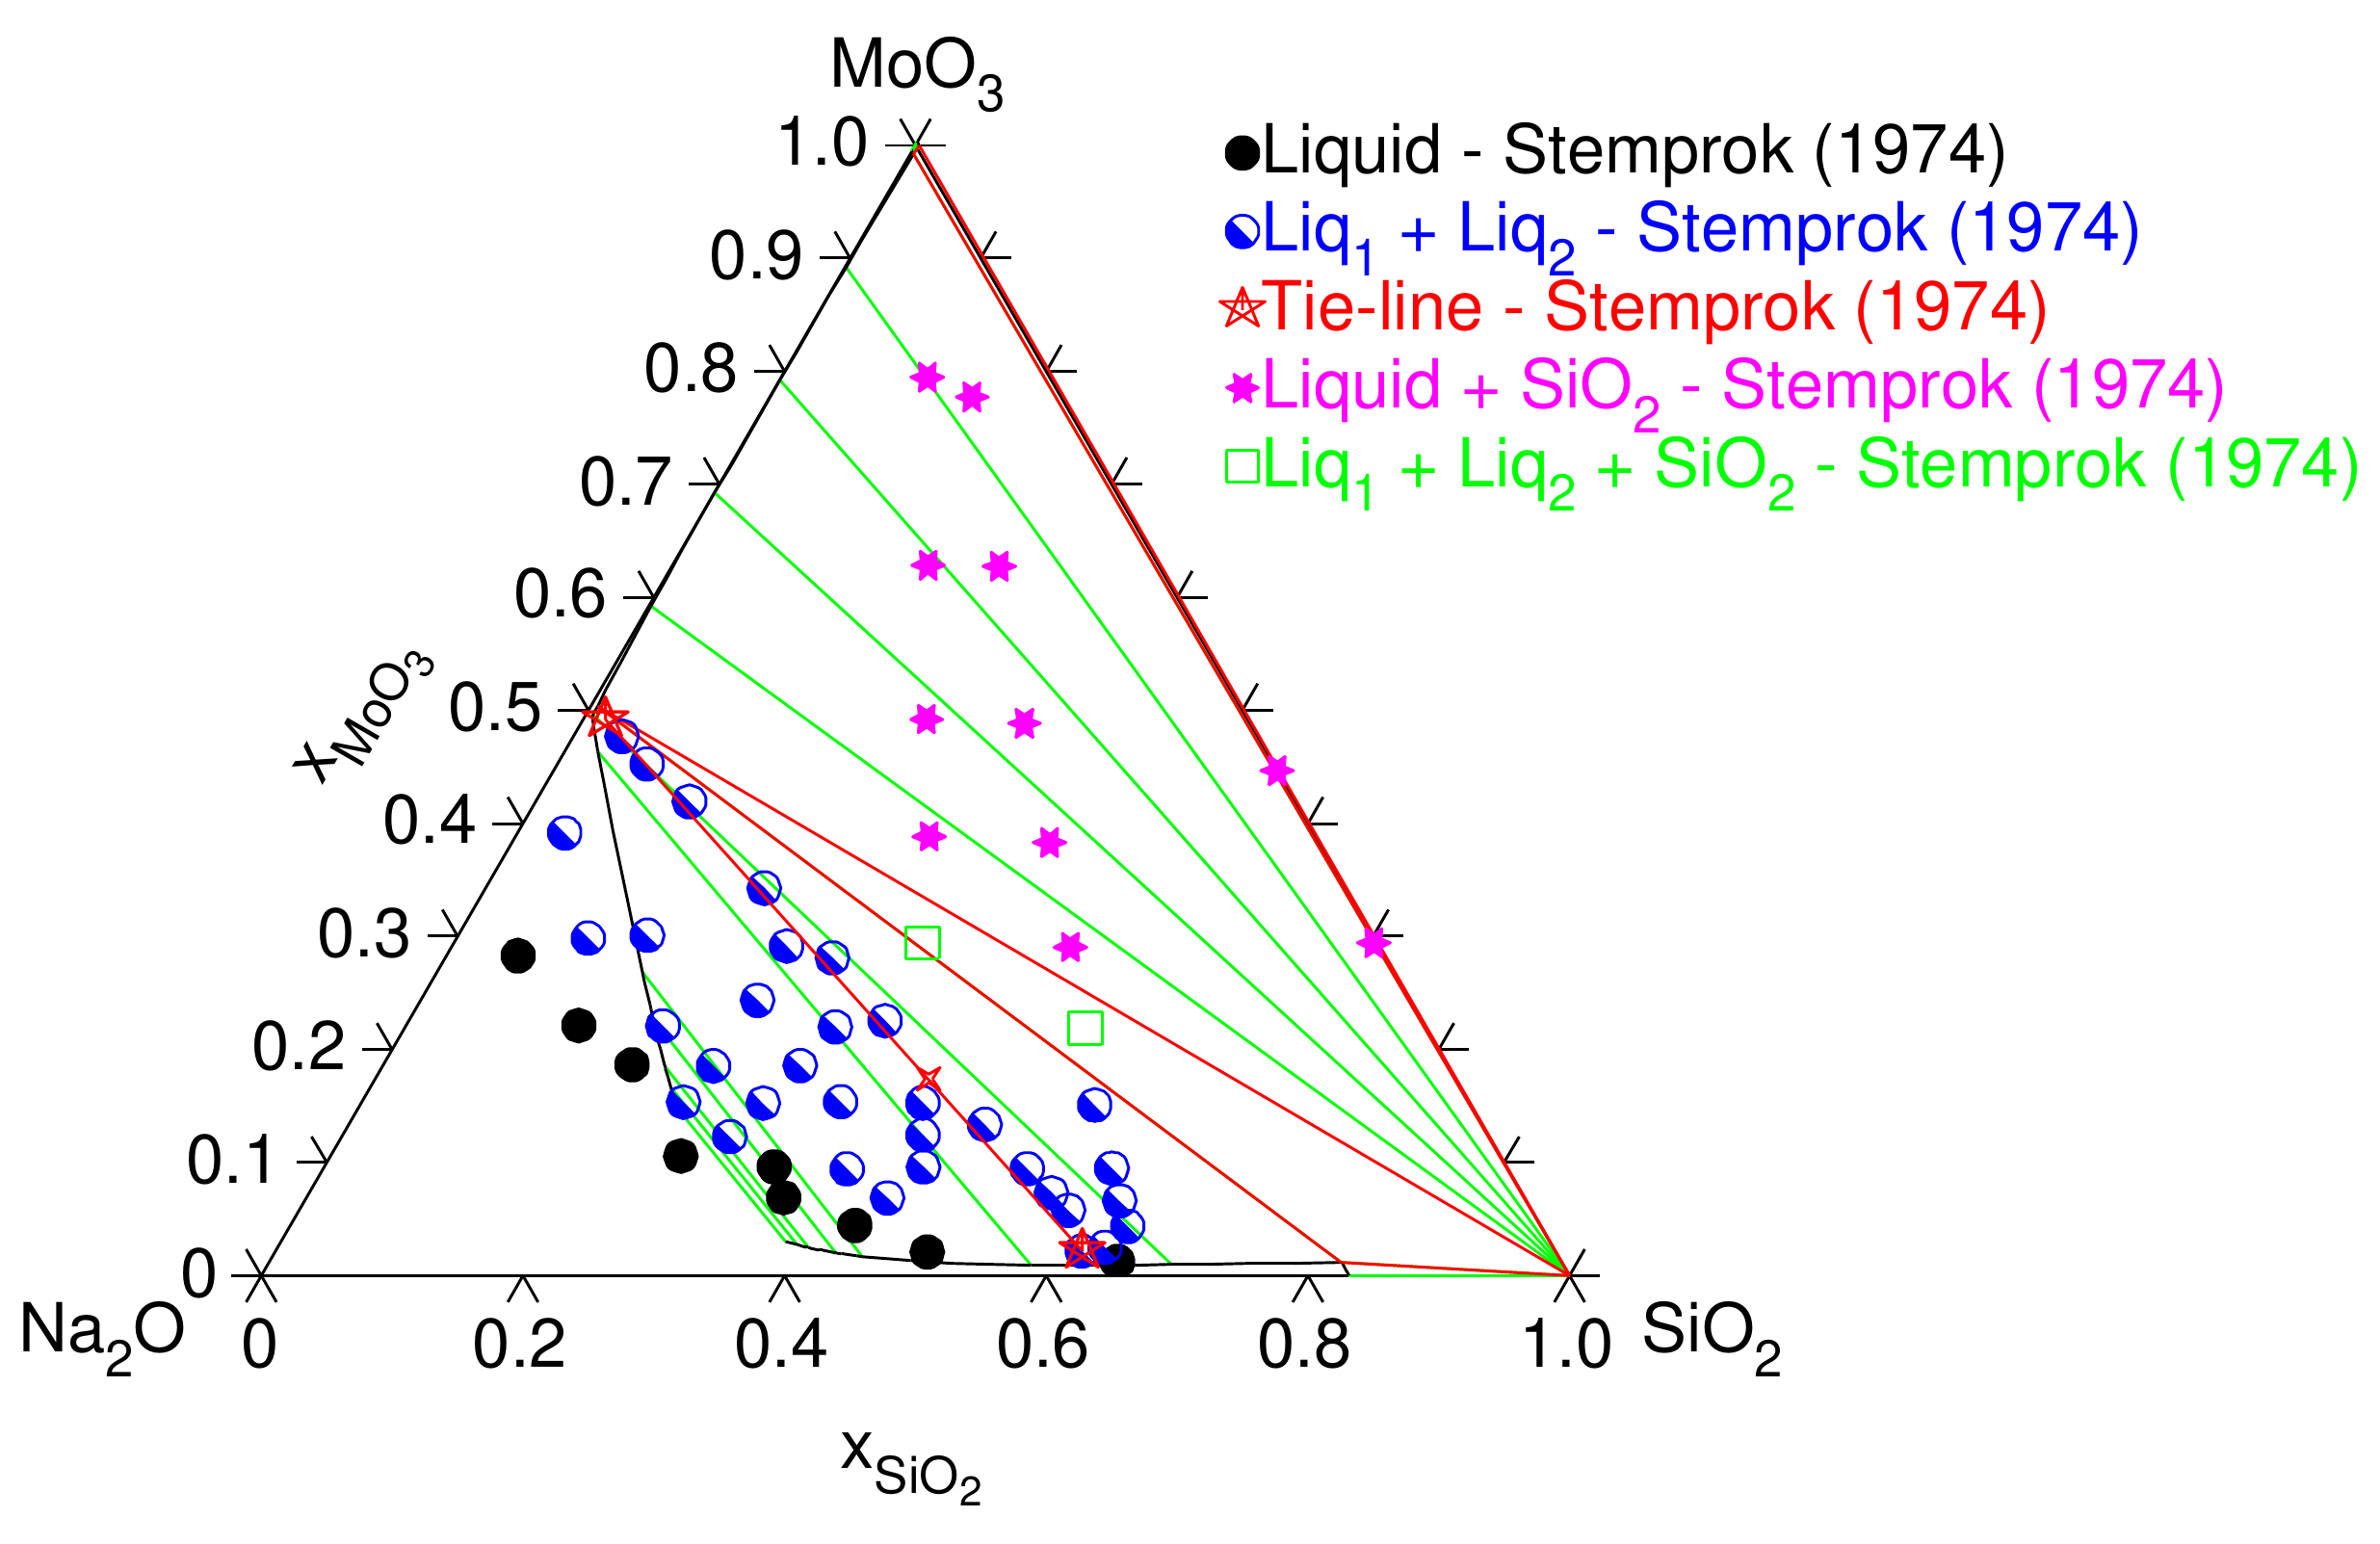
Fig. 6 Phase diagram of \(SiO_2-Na_2O-MoO_3\) (S. Bordier, PhD 2015)
Section author: Alain Cartalade